| Introduction |
| |
| The perfect echocardiographic machine would produce an infinitesimally small ultrasound beam, an incredible sweep speed and a uniform energy throughout its beam length. Even with the perfect echocardiographic machine, we are still left with the ultrasound interaction with tissues. The interaction can cause measurement errors, artifacts, and poor picture quality. An understanding of the basic interactions of tissue with ultrasound provides the basis of avoiding errors and misdiagnosis. Tissue interaction has also lead to the development of new technologies, such as automatic border detection. |
| |
| Tissue Interactions |
| |
|
Ultrasound waves, when they strike a medium, cause expansion and compression of the medium. Ultrasound waves interact with tissue in four basic manners. Those interactions are:
- Reflection
- Scattering
- Refraction
- Attenuation
|
| |
| Reflection |
| |
Reflection occurs when the ultrasound wave is deflected towards the transducer . The major factors affecting the amount of reflection are: . The major factors affecting the amount of reflection are: |
| |
- Angle of incidence
- Acoustic impedance mismatch
- Width of the tissue boundary
- Angle of tissue boundary
|
 |
| Animation 1.2.1 Reflection |
|
|
| |
The angle of incidence is the angle of the ultrasound beam and the tissue plane. For reflection, the angle of incidence is less than 90 degrees. Reflection occurs at tissue boundaries and tissue interfaces. Tissue boundaries that are perpendicular to the ultrasound wave's path act as excellent reflectors, whereas, tissue boundaries that are parallel to the ultrasound wave's path act as poor reflectors. When the ultrasound wave is not reflected, either due to a parallel tissue boundary or high acoustic impedance, the ultrasound signal is not recorded and the display shows a lack of signal or dropout of the ultrasound picture . . |
| |
| For example, in Figure 1.2.1 and Video 1.2.1, the myocardial walls that are perpendicular to the ultrasound beam are easily visualized. The myocardial walls that are perpendicular to the ultrasound beam act as excellent reflectors of the ultrasound signal. The walls parallel to the beam are not easily visualized. Walls parallel to the ultrasound signal result in poor signal reflection. In fact, the part of the parallel wall is not seen because the signal has been lost, which is commonly called dropout. |
| |
|
|

|
|
Figure 1.2.1 Dropout from Parallel Beam |
Video 1.2.1 Dropout Video |
|
| |
|
|
 |
|
Animation 1.2.2
Width & Reflection |
|
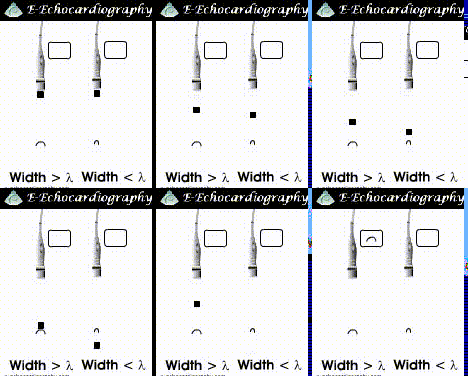
Besides angle of incidence, the tissue boundary width impacts the amount of the reflected signal. If the tissue boundary width is less than the wavelength of the ultrasound wave, the ultrasound wave will not be reflected. (Animation 1.2.2) Tissue boundaries that are smooth and have a width greater than the ultrasound wave act as a mirror or a specular reflector which results in a significant amount of reflection of the signal. |
|
| |
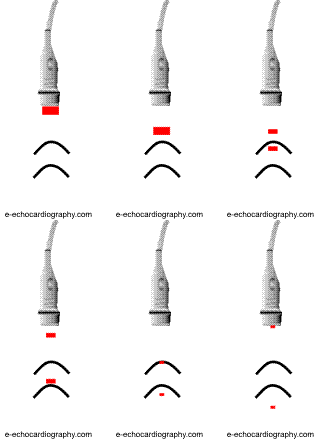
| As the ultrasound wave travels through one medium or tissue into another medium or tissue, a change in acoustic impedance occurs. The amount of change of acoustic impedance will determine the amount of reflection. Acoustic impedance is determined by the density of the tissue. Large changes in density between two tissues will result in a large change of acoustic impedance. The change in impedance between two structures is call acoustic impedance mismatch. The difference in acoustic impedance between two tissues accounts for the amount of reflection that will occur at the tissue border. In animation 1.2.3, as the ultrasound wave passes through each tissue boundary, it loses some energy or amplitude while some of the wave is reflected. |
 |
Animation 1.2.3 Reflection
through multiple boundaries |
|
|
| |
| |
| Scattering |
| |
|
|
 |
| Animation 1.2.4 Scattering |
|
Scattering occurs when the width or lateral dimension of the tissue boundary is less than one wavelength (Animation 1.2.4). If a large number of small tissue boundaries occurs, the scattering can radiate in all directions. The signal that reaches the transducer is a much weaker signal than the transmitted signal and is typically 100-1000 (40 - 60 dB) less than the transmitted signal. Most scattering occurs with red blood cells, which have a width of 7-10 µm, which is 20 times smaller than the ultrasound wavelength (0.2 to 1 mm). A filter can ignore small signals from red blood cells below a threshold value. Hematocrit has very little effect on the Doppler signal. (Animation 1.2.4). If a large number of small tissue boundaries occurs, the scattering can radiate in all directions. The signal that reaches the transducer is a much weaker signal than the transmitted signal and is typically 100-1000 (40 - 60 dB) less than the transmitted signal. Most scattering occurs with red blood cells, which have a width of 7-10 µm, which is 20 times smaller than the ultrasound wavelength (0.2 to 1 mm). A filter can ignore small signals from red blood cells below a threshold value. Hematocrit has very little effect on the Doppler signal. |
|
| |
| Refraction |
| |
Refraction occurs when the ultrasound signal is deflected from a straight path and the angle of deflection is away from the transducer (Animation 1.2.5). Ultrasound waves are only refracted at a different medium interface of different acoustic impedance. Refraction allows enhanced image quality by using acoustic lenses. Refraction can result in ultrasound double-image artifacts. (Animation 1.2.5). Ultrasound waves are only refracted at a different medium interface of different acoustic impedance. Refraction allows enhanced image quality by using acoustic lenses. Refraction can result in ultrasound double-image artifacts.
|
 |
| Animation 1.2.5 Refraction |
|
|
| |
| Attenuation |
| |
|
Attenuation is the result of an ultrasound wave losing energy . As the ultrasound wave travels through a medium, the medium absorbs some of the energy of the ultrasound wave . As the ultrasound wave travels through a medium, the medium absorbs some of the energy of the ultrasound wave . The amount of energy absorption, or acoustic impedance (Z), is determined by the product of the density of the medium and the propagation velocity of the ultrasound wave . The amount of energy absorption, or acoustic impedance (Z), is determined by the product of the density of the medium and the propagation velocity of the ultrasound wave . The acoustic impedance formula is shown below: . The acoustic impedance formula is shown below: |
|
|
|
Acoustic Impedence (Z) = Density (Ï) x Propagation Velocity (c) |
|
Figure 1.2.2 Acoustic Impedance Formula |
| |
|
|
 |
|
Animation 1.2.6 Attenuation |
|
During attenuation the ultrasound wave stays on the same path and is not deflected. As it passes through tissues of different densities, the amplitude decreases(Animation 1.2.6). If all of the ultrasound wave energy is absorbed then structures distal to the point of total attenuation will not be visualized and will appear to be "dropped". This is called dropout.
Energy is lost by reflection, scattering, and attenuation. The loss in energy results in a "noisy" background. If the signal-to-noise ratio is good then a clear picture will be displayed. A poor signal-to-noise ratio results in a blurry picture. Attenuation is frequency dependent. Low frequencies have better penetration and are therefore not attenuated as much as higher frequencies.
Below is a chart showing the frequency of the probe and the depth of penetration for that frequency. Note that as the frequency is increased penetration is decreased (Table 1.2.1). |
|
| |
|
MHz |
Depth (cm) |
|
1 |
30 |
|
5 |
6 |
|
20 |
1.5 |
| |
Table 1.2.1 Frequency & Depth |
|
| |
|
In conclusion, the factors that affect attenuation are:
- Transducer Frequency
- Acoustic Impedance
- Acoustic Impedance Mismatch
|


